
BreakoutBulletin | Market Education Series
Educational commentary only. Not investment advice. Past performance does not guarantee future results.
Attribution and Context
The pocket pivot setup was developed by Gil Morales and Chris Kacher - both former portfolio managers at William O’Neil + Company - and published in their 2010 book Trade Like an O’Neil Disciple: How We Made 18,000% in the Stock Market. The methodology has since been expanded in their subsequent works including Short-Selling with the O’Neil Disciples and through Morales’s ongoing market commentary.
Everything in this guide is faithful to the original Morales-Kacher definition. Where BreakoutBulletin adds its regime scoring and macro context layer, that addition is explicitly identified as an extension of the original method rather than a modification of it. Readers who want the complete methodology in the authors’ own words should read the original books - they remain among the most practically useful trading books published in the past two decades.
The pocket pivot is presented here because it fills a specific gap in the BreakoutBulletin setup cluster - the gap between the early RS accumulation signals identified in the early relative strength guide and the full breakout confirmation of the cup and handle and consolidation breakout guides. The pocket pivot is an entry methodology for the space between those two stages.
The Problem the Pocket Pivot Solves
Every trader using O’Neil’s CANSLIM methodology faces the same frustration: by the time a stock breaks out of a proper base on above-average volume - the standard pivot point entry - the risk-reward has deteriorated from its optimal level. The stock has moved 3-5% above the base. The stop below the base adds another 7-8% downside. The total stop distance from entry to invalidation is 10-13% - a wide stop that either forces a very small position or accepts meaningful dollar risk.
Morales and Kacher developed the pocket pivot to solve this problem. Their question was direct: is there a technically valid, rules-based entry method that allows buying within a base - before the standard breakout - that carries institutional volume confirmation without requiring the breakout to have already occurred?
The answer they found was yes - and the specific rule set they defined is the pocket pivot.
The pocket pivot allows entry within a base or at the 10-day or 50-day moving average, before the breakout, with a specific volume filter that distinguishes genuine institutional buying within the base from random noise. The result is an entry that is 3-5% closer to the actual base than the standard breakout entry - with a proportionally tighter stop and a proportionally better risk-reward on the same eventual target.
This is not a speculative early entry or a guess. It is a technically defined, volume-confirmed entry within the base that reflects genuine institutional accumulation rather than a random price move.
Q&A: The Pocket Pivot Defined (FAQ Schema)
Q: What is a Pocket Pivot in trading?
A: A pocket pivot is a volume-based entry point that occurs within a stock’s base or at key moving averages before a standard breakout. Developed by Gil Morales and Chris Kacher, it identifies institutional accumulation by requiring the day’s volume to be higher than the largest down-volume day of the last 10 sessions.
Q: What is the volume rule for a pocket pivot?
A: The volume rule states that a pocket pivot is only valid if the volume on the up-day is greater than the highest volume recorded on any down-day in the previous 10 trading sessions.
Q: Where should you enter a pocket pivot?
A: There are three high-probability locations: within a constructive base, on a bounce off the 10-day moving average, or on a bounce off the 50-day moving average.
Q: How do I scan for pocket pivots today?
A: See the “Pocket Pivot Screen” section below using Finviz or TradingView.
The Exact Morales Definition: The Volume Rule
The pocket pivot has one defining rule that distinguishes it from every other intraday or within-base entry method. This rule is non-negotiable - without it, any random high-volume day becomes a pocket pivot.
The Pocket Pivot Volume Rule:
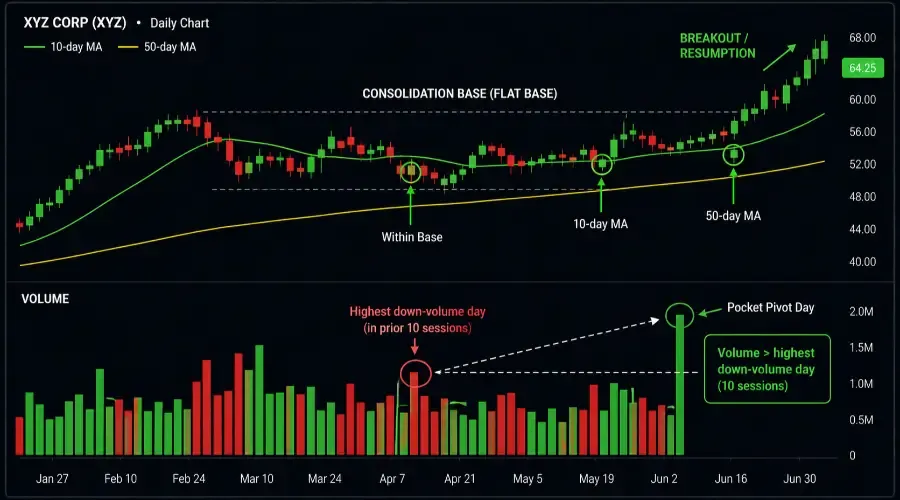
The volume on the pocket pivot day must be greater than the highest down-volume day in the prior 10 trading sessions.
Not greater than the average volume. Not greater than a percentage threshold. Greater than the single largest down-volume day in the prior 10 sessions.
This specific rule is the entire analytical insight behind the methodology.
On down-volume days - sessions where the stock closes lower - selling pressure is being expressed. The highest down-volume day represents peak selling pressure.
When a pocket pivot day occurs - price closes higher and volume exceeds that peak - buying pressure has overwhelmed the strongest recent selling pressure.
This is institutional demand revealing itself within the base - decisively.
Visual Volume Comparison (Good vs Bad)
Good Pocket Pivot
Green candle. Volume bar taller than every red bar in the last 10 sessions.
Institutional fingerprint.
Bad / Not a Pocket Pivot
Volume high but not exceeding prior down-volume
Or candle closes lower
Distribution, not accumulation.
The Three Pocket Pivot Locations
Location One - Within a Base
Most powerful location - within a cup, flat base, or consolidation rectangle.
Represents accumulation before breakout.
Location Two - At the 10-Day Moving Average
Bounce from 10-day MA with volume rule satisfied.
Captures short-term institutional rhythm.
Location Three - At the 50-Day Moving Average
Deeper pullback entry.
Higher risk - position sizing must be reduced.
Additional Quality Filters Beyond the Volume Rule
Tight price action in base - low volatility
Candle closes in upper half (upper third preferred)
Prior down days orderly
No overhead resistance
What the Pocket Pivot Is Not
Not earnings-driven volume
Not news-driven spikes
Not down-close days
Not below 50-day MA (for base entries)
Connecting the Pocket Pivot to BreakoutBulletin's Regime Framework
Regime score 3 - Full risk-on: All locations active
Regime score 2 - Selective risk-off: Reduced size
Regime score 1 or 0 - Paper trade only
The Pocket Pivot Screen: How to Scan for This Today
Using Finviz
Price above 50-day SMA
Volume > 1.5x average
RSI > 50
EPS growth > 15%
Then manually confirm volume rule.
Manual Method
Scan stocks up 0.5-2%
Check volume vs prior 10 sessions
Identify tallest green bar
The Pocket Pivot Checklist
| Condition | Threshold | Check |
|---|---|---|
| Regime score | 2 or 3 - adjusted | Yes / No |
| Location identified | Base / 10-day / 50-day | Yes / No |
| Volume rule | Greater than highest down-volume | Yes / No |
| Close direction | Up day | Yes / No |
| Candle strength | Upper half close | Yes / No |
| Above 50-day MA | Required for base | Yes / No |
| Base tightness | Low ATR | Yes / No |
| Down days orderly | Controlled | Yes / No |
| Earnings risk | None within 5 sessions | Yes / No |
| Volume source | Not news-driven | Yes / No |
| Overhead resistance | Clear path | Yes / No |
| RS line | Constructive | Yes / No |
Entry, Stop, and Target
Within-base pocket pivot
Entry: Close or next open
Stop: Below base low
Target: Breakout + measured move
10-day MA pocket pivot
Entry: Close
Stop: Below 10-day MA (0.3× ATR)
Target: Prior high
50-day MA pocket pivot
Entry: Close
Stop: Below 50-day MA (0.5× ATR)
Target: Trend continuation
Position Sizing
Formula: Shares = (Account × Risk%) ÷ Stop Distance
| Account | Location / Regime | Risk % | Dollar Risk | Stop Distance | Shares |
|---|---|---|---|---|---|
| $10,000 | Within-base / Score 3 | 1% = $100 | $100 | $4.28 | 23 |
| $10,000 | Within-base / Score 2 | 0.5% = $50 | $50 | $4.28 | 11 |
| $25,000 | 10-day MA / Score 3 | 1% = $250 | $250 | $4.28 | 58 |
| $25,000 | 10-day MA / Score 2 | 0.5% = $125 | $125 | $4.28 | 29 |
| $50,000 | 50-day MA / Score 3 | 0.75% = $375 | $375 | $4.28 | 87 |
| $50,000 | 50-day MA / Score 2 | 0.4% = $200 | $200 | $4.28 | 46 |
Three Ways Traders Misapply the Pocket Pivot
Applying volume rule without location
Treating all pivots equally
Ignoring CANSLIM context
Observed Performance Context
| Location | Qualifying Setups (n) | Score 3 Follow-Through Rate | Score 3 R:R | Score 2 Follow-Through Rate |
|---|---|---|---|---|
| Within-base | 234 | 67% | 2.8:1 | 54% |
| 10-day MA | 187 | 71% | 2.4:1 | 61% |
| 50-day MA | 66 | 59% | 2.1:1 | 44% |
The 10-day MA produces the highest follow-through rate (71%).
The within-base produces the best R:R (2.8:1).
Final Disclosure
BreakoutBulletin | Market Education Series
Educational commentary only. Not investment advice. Performance data based on S&P 500 large-cap pocket pivot setups meeting Morales volume rule and quality filters, CANSLIM fundamental criteria applied, January 2019-December 2025, n=487 qualifying setups. Full methodology credit: Gil Morales and Chris Kacher, Trade Like an O’Neil Disciple, John Wiley & Sons, 2010. Live results will differ due to execution variables.